In the Name of Climate:
Private vs. Public Funds
Abdulla Zaid, MSCI Research
Rumi Mahmood, MSCI Research
Whether investors want to reduce their carbon footprint or increase exposure to clean energy, the recent surge in climate related funds ensures there is a product to suit every objective.
Across both public and private markets, the market has attracted $590.5 billion in assets and offers access to a diverse range of strategies.
An outsized proportion of that asset growth occurred between 2020 and the end of Q3 2023.
Such rapid growth requires investors to be much more selective, which is why obtaining clearer information on climate funds’ holdings has now become a crucial factor in assessing the right strategy to invest in.
In this blog post we look behind the names to highlight the trends in fundraising, sector composition and the key underlying asset classes, to help investors make more informed decisions.
Key takeaways:
- The number of public and private funds with climate-related names has surged in recent years, with more than 70% of the cumulative capitalization attributed to funds launched since the start of 2020.
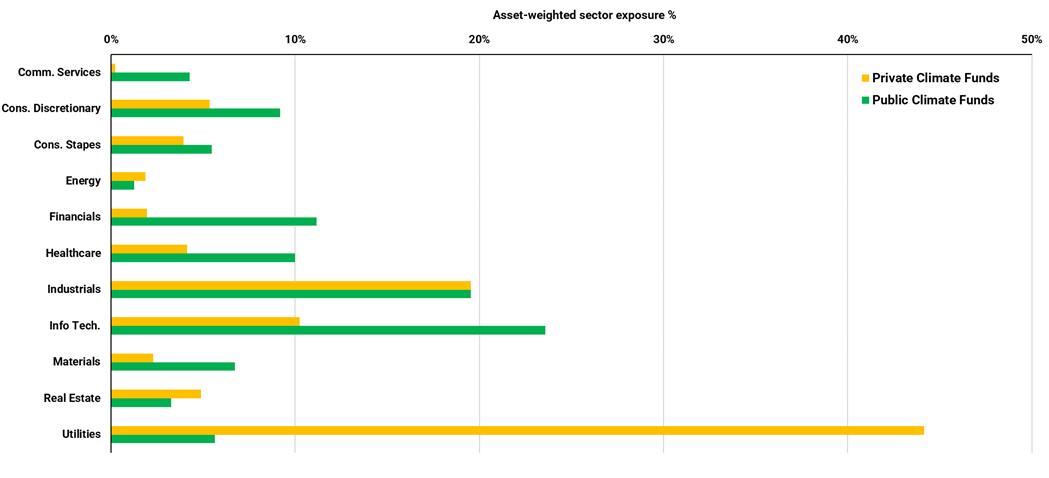
- Despite similarity in the names, these funds are rather different. Renewable electricity accounted for over 40% of private climate funds’ net asset value, while information technology dominated in public climate funds.
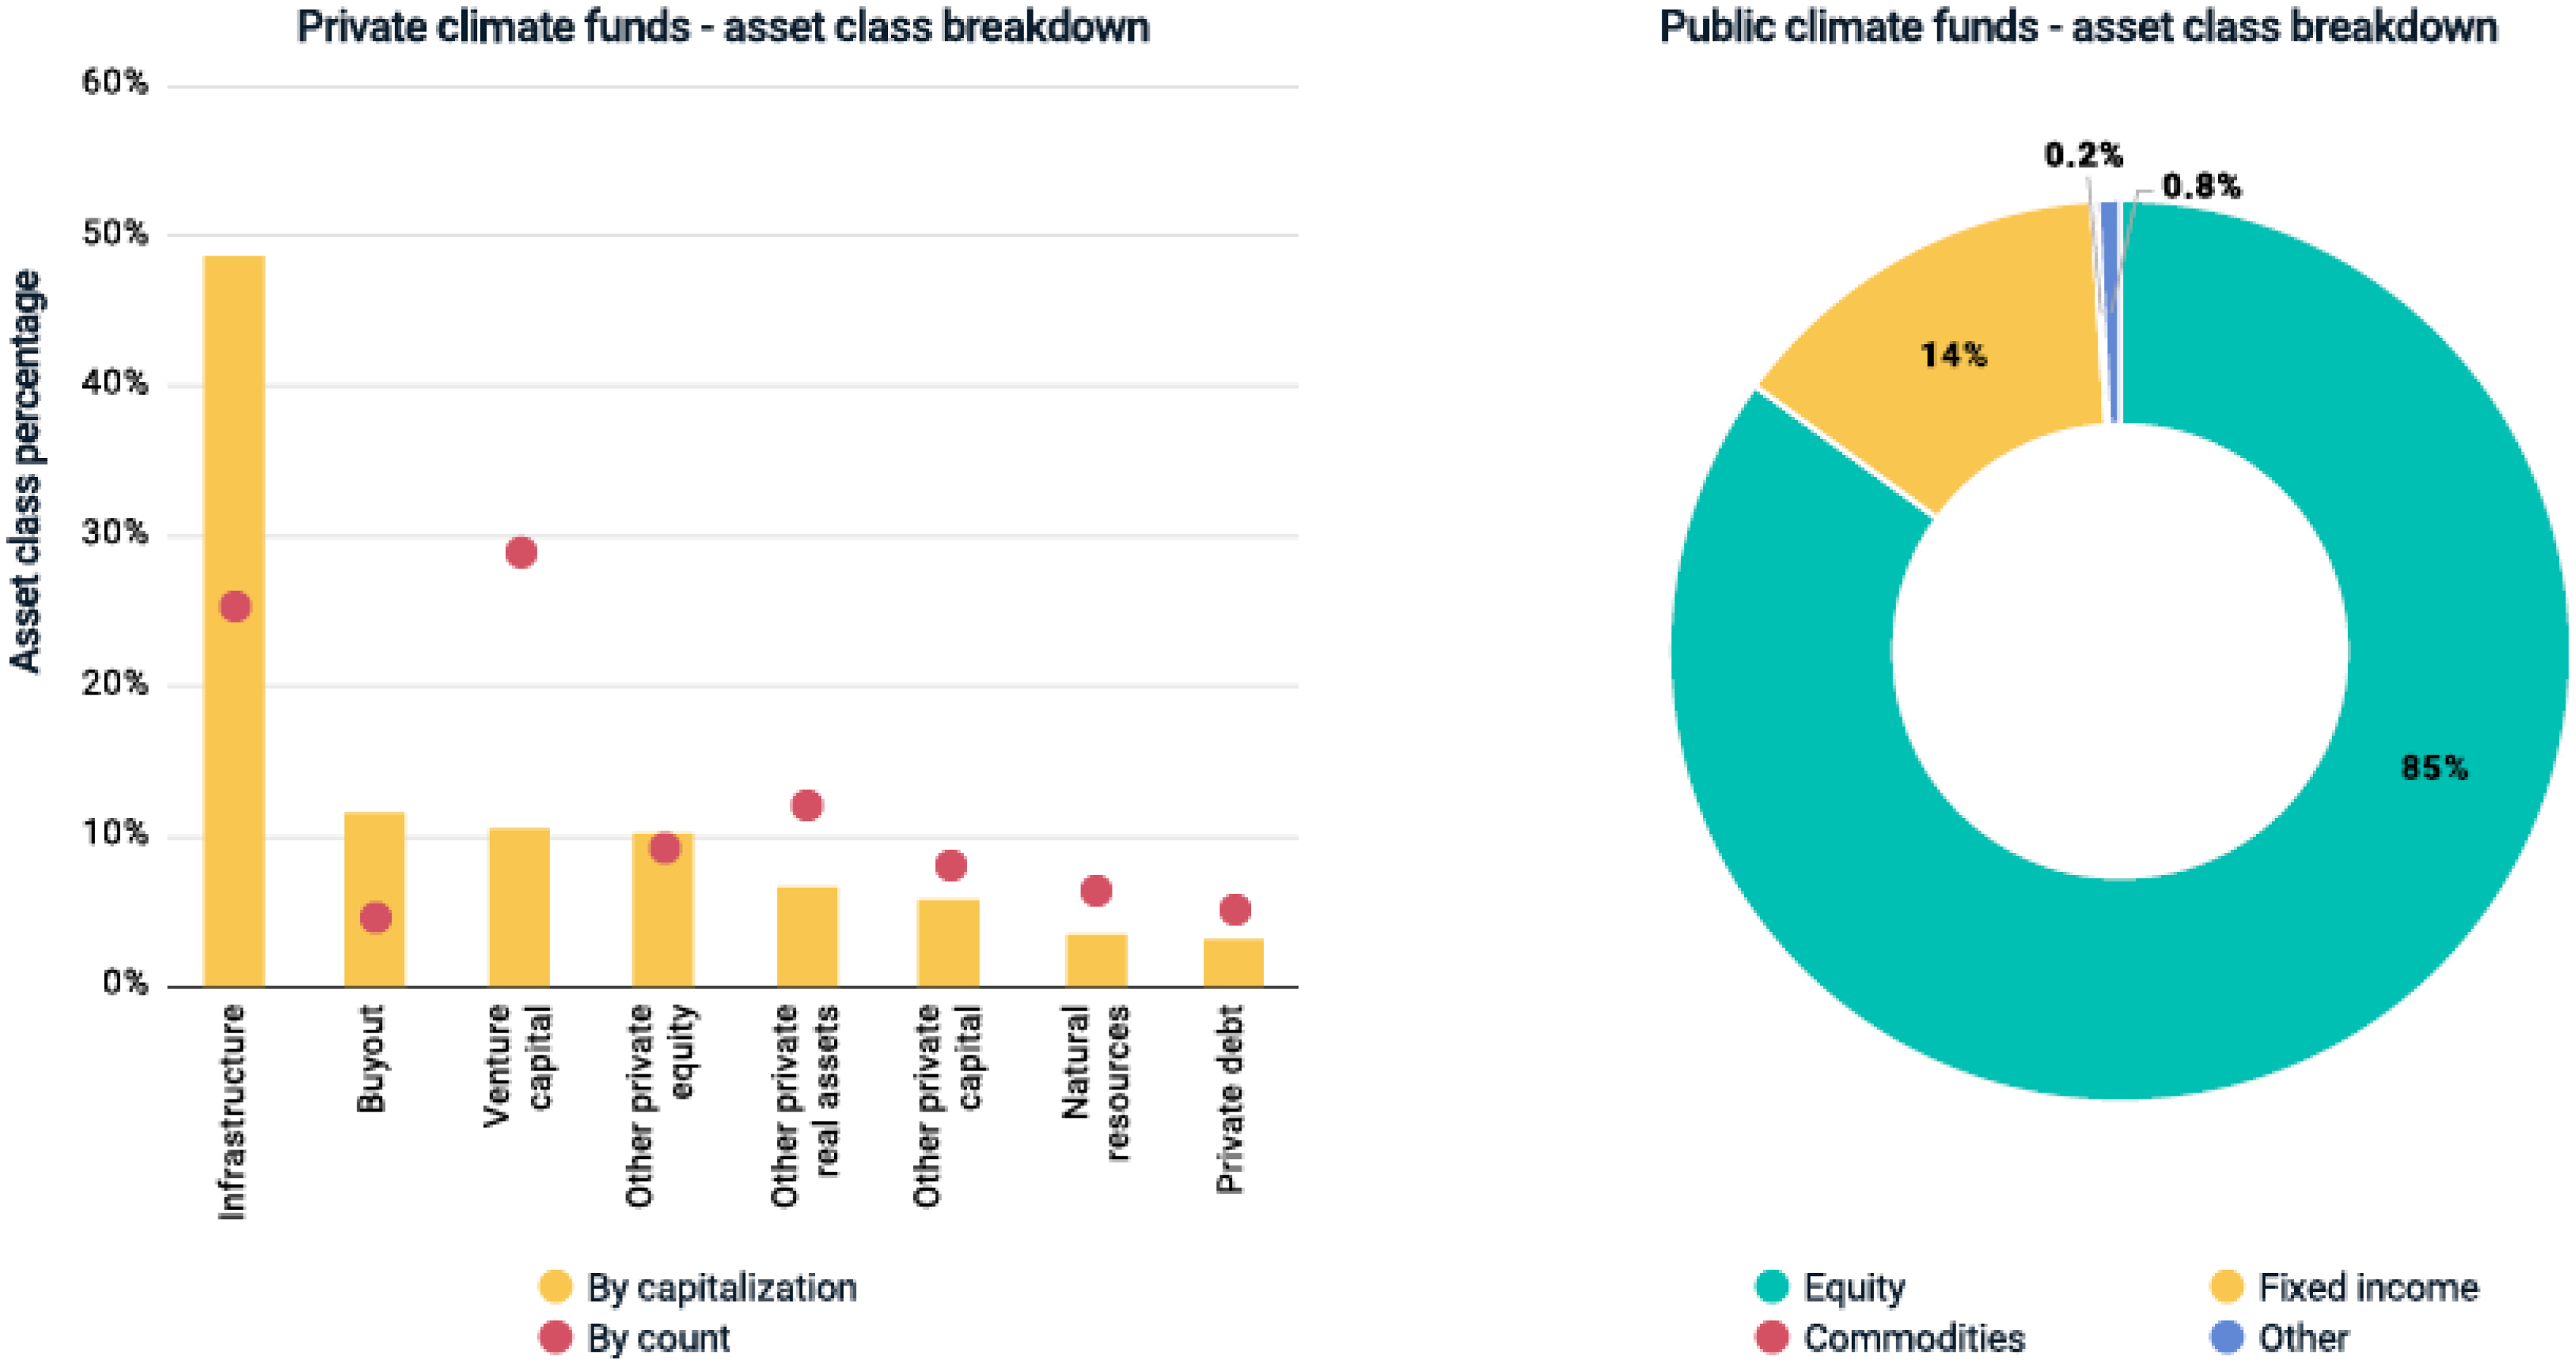
- Real assets drove private climate funds, while equity was more prominent in the public space.
The green rush is underway
The growth of climate funds in the public space has become established in recent years, with almost a decade of fund launches since the 2015 Paris Agreement. There are now more than 1,300 funds globally with assets under management (AUM) of over USD 500 billion. Over 70% of public climate funds in the market were launched between 2020 and Q3 2023, representing almost 80% of AUM.
In private markets, there was a total of 173[1] private-capital funds with climate-related names, accounting for a cumulative capitalization[2] of about USD 90.5 billion, as of Q3 2023 and before COP28. The climate funds that were launched between 2020 and Q3 2023 alone outweighed funds launched in the previous nine years combined, representing nearly 73% of the USD 90.5 billion cumulative capitalization and about 43% of the total count.
The recent rush in climate funds

Same names, different outcomes
As of Q3 2023, about 64% of private climate funds had exposure to the sub-industries best positioned to benefit from the net-zero transition, in what are otherwise carbon-intensive sectors — utilities and industrials.[3] Within utilities, renewable electricity alone accounted for about 41% of the aggregate net asset value (NAV). For industrials, which accounted for nearly 21% of NAV, exposure was mostly in heavy electrical equipment (5.1%), environmental and facilities services (4.9%) and electrical components and equipment (3.0%).
In the public space, information technology and industrials dominated, largely through low-carbon ETFs and mutual funds that invest in companies with reduced carbon intensity or carbon footprint relative to a benchmark, along with a relative underweight to carbon-intensive sectors. Exposure to the utilities sector accounted for less than 6% on an asset-weighted basis in public climate funds.
Private climate funds concentrated in high-emitting sectors

Data as of Sept. 30, 2023. The aggregate private-investment NAV is about USD 36.6 billion in private climate funds, with sectors weighted by the holdings’ NAVs. Publicly listed funds include 1,342 climate ETFs and mutual funds with AUM of USD 526 billion. Source: MSCI ESG Research, MSCI Private Capital Solutions
Infrastructure and venture capital in private funds, equity in public funds
Infrastructure funds accounted for the largest portion of private climate funds, representing nearly half the cumulative capitalization and about one-quarter of the count, as of Q3 2023. Infrastructure funds’ heavy presence may reflect the outlined investment concentration in renewable electricity and industrials. Meanwhile, venture-capital funds have emerged as a key player in climate investing, accounting for 29% of the fund count — more than double the combined share across the rest of private-equity funds. Over half of venture-capital funds’ NAV in this subset was in early-stage companies, with over half of these companies operating in the industrials and materials sectors. In the public space, equity was dominant, accounting for 85% of climate funds, while debt remained mostly absent and green-bond funds largely servicing this space in public markets.
Private vs. public climate funds by asset class; debt underrepresented in both

Bridging the gaps to greener pastures
Transparency into climate funds’ holdings may help investors evaluate climate strategies such as reducing a portfolio’s financed emissions and financing low-emissions solutions. As well as understanding the underlying holdings of climate funds, further disclosures may be necessary across different sustainability dimensions. New market-based initiatives have emerged to provide climate transparency that may help channel more capital in this space. The ESG Integrated Disclosure Project[4] is one example of an initiative that could encourage more consistent private-market disclosure and facilitate material comparison between various strategies for climate investment.
[2] Cumulative capitalization is the aggregate of the funds’ sizes.
[3] Sector definitions according to the Global Industry Classification Standard (GICS®). GICS is the global industry classification standard jointly developed by MSCI and S&P Global Market Intelligence.
[4] “ESG Integrated Disclosure Project (ESG IDP),” ESG IDP, 2023.
More from MSCI
Solutions for Wealth Managers
We power portfolio design, customization and analytics, creating client value at scale for wealth managers.
ESG Ratings & Climate Search Tool
Search by company name, ticker or fund to view the ESG and climate risks and opportunities the company or fund might face
Understanding Institutional Investors’ Perspective on ESG Ratings
This report aims to provide issuers with a sense of how investors may think about ESG factors across the entire investment process.


